
Ethereum (ETH/USDT) 1-Hour Chart Analysis – March 12, 2025
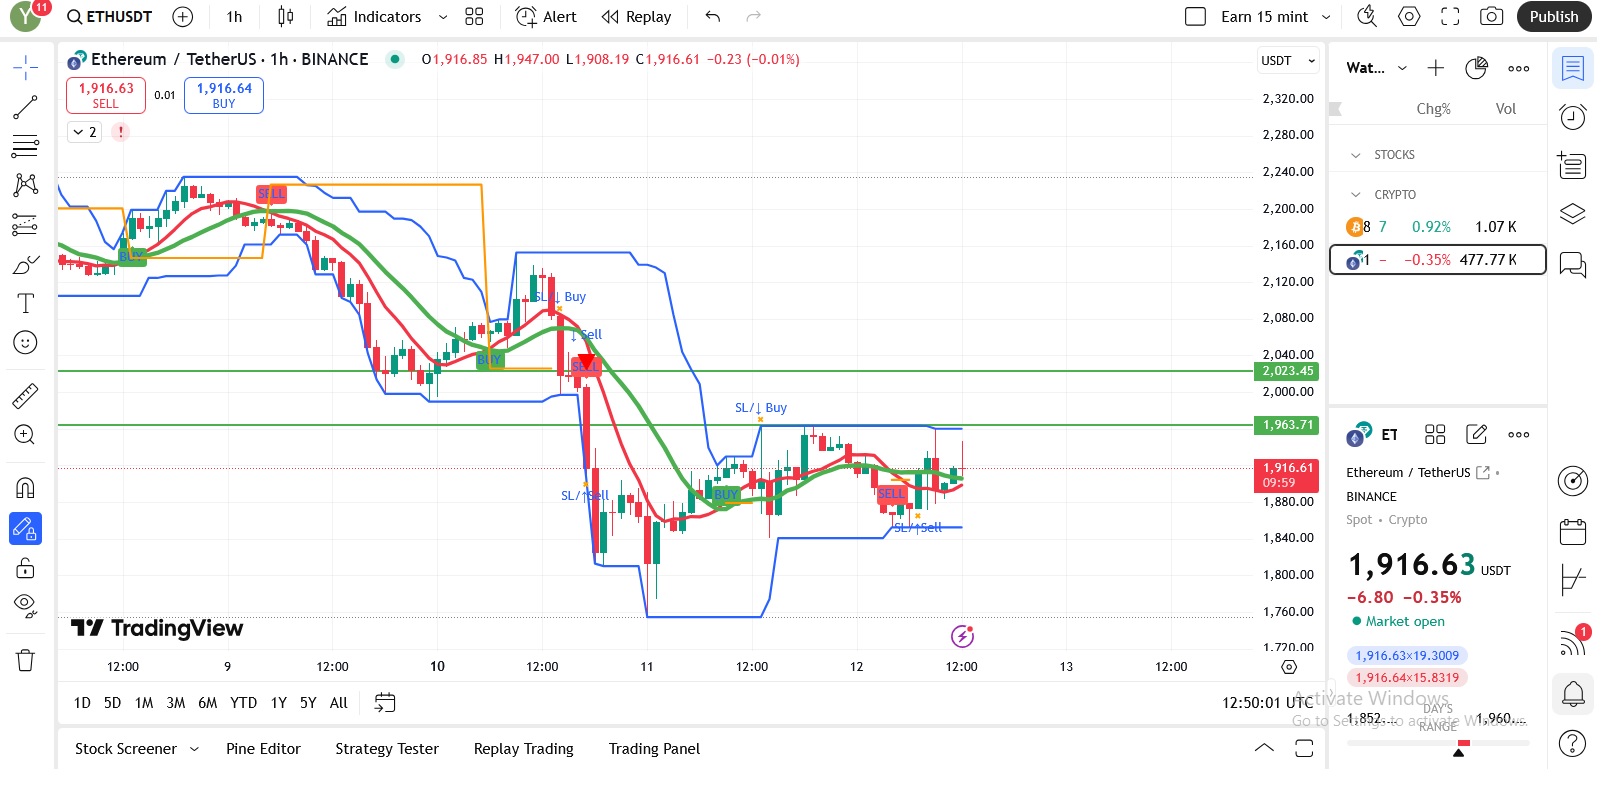
Ethereum (ETH) is currently trading at $1,921.60, reflecting a -0.10% decline in the last session. The cryptocurrency market remains highly volatile, with ETH experiencing minor fluctuations within a short-term consolidation phase. This analysis explores Ethereum’s recent price action, key technical indicators, and potential trading strategies.
1. Current Market Overview
- Current Price: $1,921.60
- 24-Hour Range: $1,852 – $1,960
- 52-Week Range: $1,754.28 – $4,107.80
- Market Status: Open
Ethereum is currently moving within a narrow range, showing indecisiveness among traders. With a support level forming around $1,880 and resistance near $1,963, traders are closely monitoring price action for potential breakout or breakdown scenarios.
2. Technical Analysis
A. Support & Resistance Levels
| Level | Type | Significance |
|---|---|---|
| $1,963.71 | Resistance | Key resistance, price rejected multiple times |
| $2,023.45 | Resistance | Strong resistance, potential breakout zone |
| $1,921.50 | Pivot | Current price level, neutral trend |
| $1,880 – $1,860 | Support | Key support area, recent bounce zone |
| $1,852 | Support | Lowest daily support, critical for buyers |
B. Trend & Moving Averages
- The Exponential Moving Average (EMA) indicators suggest mixed momentum:
- Short-term (red line): Price fluctuating around it, indicating sideways movement.
- Mid-term (green line): Slight upward slope, but not strongly bullish yet.
- The price is hovering near the moving averages, meaning ETH is neither in a strong uptrend nor a downtrend. A clear breakout above resistance could trigger bullish momentum.
C. Bollinger Bands & Volatility
- The Bollinger Bands (blue lines) indicate low volatility, as the bands are narrowing.
- If a breakout occurs, increased volatility can be expected.
- Price is testing the middle band, meaning the next move will confirm whether it trends up or down.
D. Buy & Sell Signals (Indicator-Based)
- Recent Buy Signals: Indicated near $1,880, suggesting demand in that range.
- Sell Signals: Occurred at $1,921 – $1,926, indicating resistance pressure.
- Stop-Loss (SL) Levels:
- Buy SL: Placed at $1,880, meaning a break below could trigger further downside.
- Sell SL: Positioned near $1,960, meaning a breakout above could lead to a bullish rally.
3. Market Sentiment & Price Action
Ethereum’s price action suggests range-bound consolidation, with neither bulls nor bears dominating. However, the following conditions could influence price movement:
✅ Bullish Case (Breakout Above $1,963)
- A break above $1,963 could trigger a move towards $2,023, with further potential to $2,080 – $2,100.
- Stronger buying volume would confirm this breakout.
❌ Bearish Case (Break Below $1,880)
- If ETH drops below $1,880, a decline to $1,850 – $1,820 is likely.
- A break below $1,800 could lead to a deeper correction toward $1,750.
📌 Key Watch:
- A breakout or breakdown with high volume will confirm the next major move.
4. Trading Strategy
📍 For Long Positions (Bullish Traders):
- Entry: Buy on breakout above $1,963.
- Target: $2,023 – $2,080.
- Stop-Loss: Below $1,880.
📍 For Short Positions (Bearish Traders):
- Entry: Sell if price drops below $1,880.
- Target: $1,850 – $1,820.
- Stop-Loss: Above $1,963.
5. Conclusion & Final Outlook
Ethereum remains in a neutral consolidation phase, waiting for a decisive breakout. The key levels to watch are $1,963 (resistance) and $1,880 (support). Traders should monitor volume and price action for confirmation of the next trend.
💡 Verdict:
- Bullish Above: $1,963
- Bearish Below: $1,880
- Neutral Between: $1,880 – $1,963
🚀 Potential for a breakout soon – be ready for the next big move!