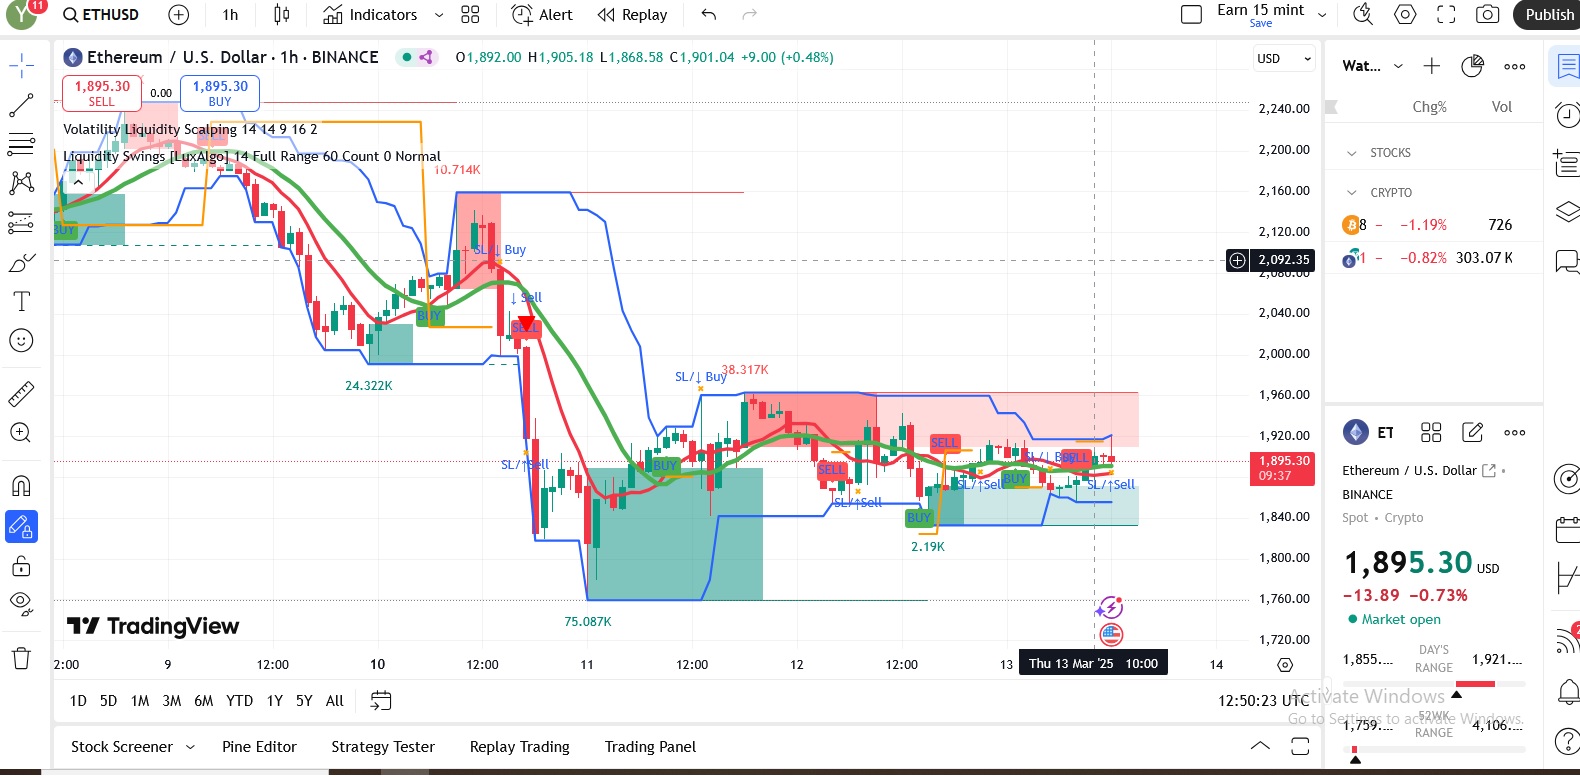
Ethereum (ETH/USDT) 1-Hour Chart Analysis – March 13, 2025 PM
deenpa
March 13, 2025

Current Market Overview
- Current Price: $1,895.30
- Price Change: -0.73% (-$13.89)
- Market Status: Open
- Day’s Range: $1,855 – $1,921
- 52-Week Range: $1,759 – $4,106

Technical Analysis
1. Trend Analysis
- The overall trend appears bearish, with ETH making lower highs and lower lows.
- The green moving average (likely a 50 EMA) is acting as dynamic resistance.
- ETH is currently in a consolidation phase after a sharp downtrend.
2. Support & Resistance Levels
- Support: $1,855 (Short-Term), $1,800 – $1,820 (Major Buyer Zone).
- Resistance: $1,920 – $1,950 (Immediate Selling Pressure), $2,000 (Key Psychological Level).
3. Buy & Sell Signals
- Multiple “BUY” and “SELL” signals are generated by the indicator-based strategy on the chart.
- The red zones indicate selling pressure, while green zones show buying support.
- SL (Stop Loss) markers suggest that the strategy is using risk management to exit trades quickly.
4. Volume & Liquidity
- High liquidity points marked in blue, with major levels at 24.32K & 75.08K volumes.
- A spike in volume near major price swings indicates institutional or whale activity.
- The volatility-based liquidity scalping indicator is mapping liquidity grab areas.
Market Sentiment & Trading Strategy
Bullish Scenario
- If ETH breaks above $1,920, it could push towards $2,000.
- Entry: Buy near $1,880 – $1,900 with confirmation from volume.
- Stop Loss: Below $1,855.
- Target: $1,950 – $2,000.
Bearish Scenario
- If ETH fails to break above $1,920, expect a drop toward $1,855 – $1,820.
- Entry: Sell near $1,915 – $1,920.
- Stop Loss: Above $1,950.
- Target: $1,855 – $1,820.
Conclusion
- Short-Term: Consolidation with slight bearish bias.
- Medium-Term: ETH needs to break $1,920 for bullish momentum.
- Long-Term: ETH remains in a downtrend unless it reclaims $2,000+.
- Traders should watch liquidity zones and breakout levels for better entries.


Leave a Reply Cancel reply