
Ethereum (ETH/USD) 1-Hour Chart Analysis – March 12, 2025
Market Overview
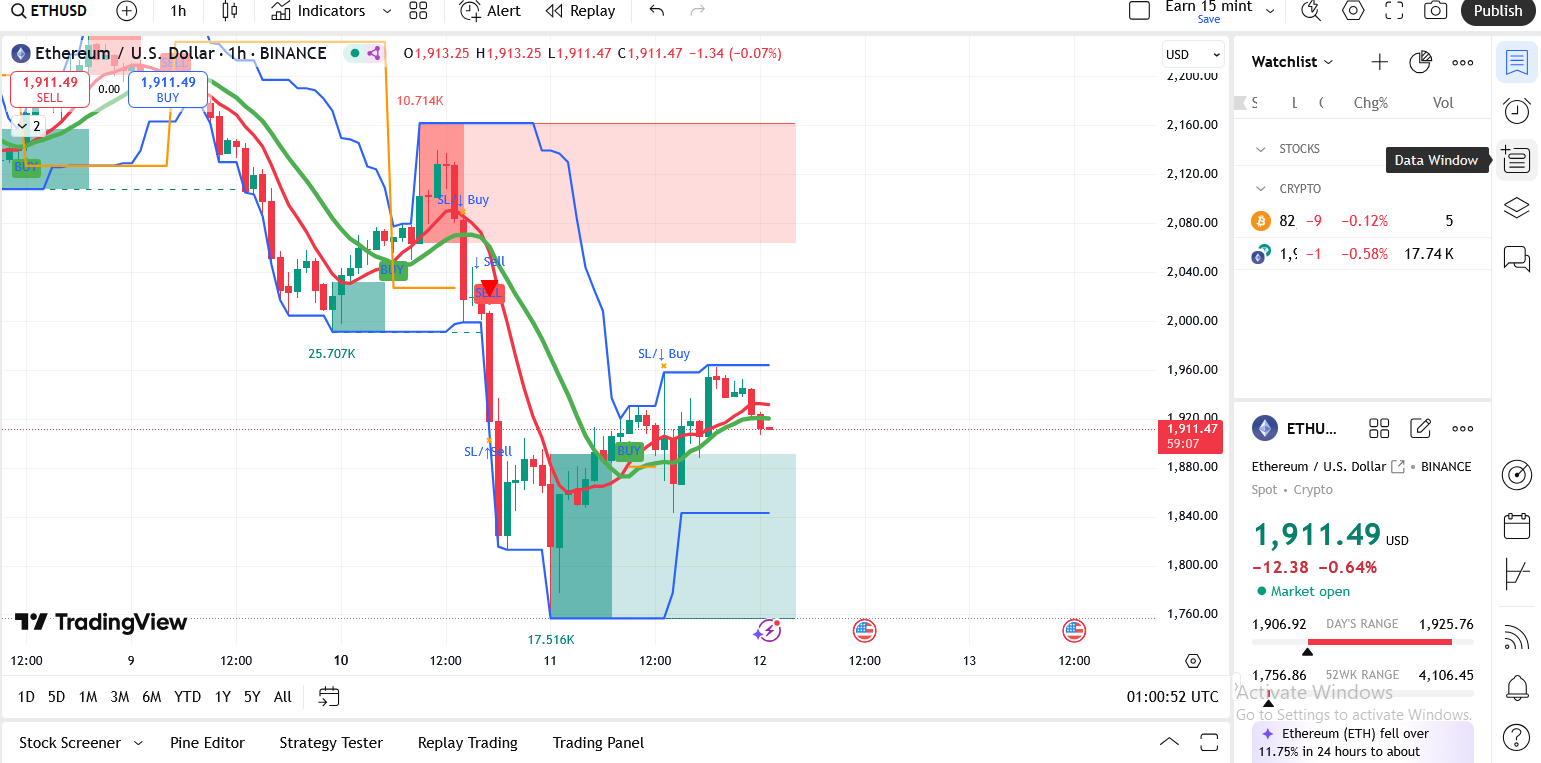
- Current Price: $1,911.49 (-0.64%)
- 24H Price Range: $1,906.92 – $1,925.76
- 52-Week Range: $1,756.86 – $4,106.45
- Market Sentiment: Bearish with signs of short-term recovery
Technical Analysis
1. Trend Analysis
- The overall trend is bearish, as indicated by a steep decline from above $2,100 to current levels.
- Recent candles show a slight recovery attempt but remain below key resistance zones.
- Moving Averages:
- The green line (EMA) shows a downward slope, confirming the short-term downtrend.
- The red trendline (SMA/EMA crossover) suggests possible trend exhaustion, but further confirmation is needed.
2. Support & Resistance Levels
- Resistance:
- $1,925 – $1,950 (Near-term resistance, recent rejections)
- $2,000 – $2,050 (Psychological resistance)
- Support:
- $1,900 – $1,906 (Current support zone)
- $1,869 – $1,880 (Previous strong support)
- $1,760 – $1,800 (Last major demand zone from 2024)
3. Key Indicator Insights
- Liquidity Swings & Stop Loss Areas:
- Large stop-loss liquidity clusters above $1,925, suggesting potential liquidity grabs before reversal.
- Volume:
- Strong sell volume accompanied the breakdown, but buying pressure is increasing in the current zone.
- Bollinger Bands & Volatility:
- The price is hovering near the lower band, signaling oversold conditions.
- If the bands tighten, expect consolidation; if they widen, expect a breakout soon.
Market Sentiment & Predictions
📉 Bearish Scenario:
- If ETH fails to reclaim $1,925, further downside to $1,880 – $1,869 is possible.
- A breakdown below $1,860 could trigger a fall towards $1,800 – $1,760.
📈 Bullish Scenario:
- If ETH can hold $1,900+ and push above $1,950, it may retest $2,000 in the short term.
- A breakout above $2,050 could invalidate the bearish structure.
Trading Strategy Recommendations
📌 Short-Term Traders:
- Look for sell entries near $1,925 with a target of $1,880.
- Place a stop-loss above $1,950 to avoid fakeouts.
📌 Long-Term Investors:
- Dollar-cost averaging (DCA) is advised between $1,900 – $1,800 for a long-term accumulation.
- A confirmed breakout above $2,050 signals a good buying opportunity.
Conclusion
Ethereum is currently in a downtrend but showing signs of a potential reversal. Traders should watch key resistance at $1,925 and support at $1,900. A break below support could trigger further downside, while a breakout above $1,950 would signal recovery.